UC5
Volt-VAr optimization with increasing RES generation
1. Description of the Use Case
1.1. Name of the Use Case
| ID | Area /Domain(s)/Zone(s) | Name of the Use Case |
|---|
| 1 | Distribution DER / Field, Station, Operation, | UC5 |
1.2. Version Management
| Version No. | Date | Name of author(s) | Changes | Approval status |
|---|
| 0.9 | 2020-11-25T00:00:00 | Nikolaos Livanos, Vaggelis Alifragkis, Georgios Stravopodis, | None | None |
1.3. Scope and Objectives of Use Case
| |
|---|
| Scope | The scope of the proposed Use Case is to implement Volt-VAr optimization approaches in the context of the eBalance+ project, by means of intelligent management units and optimization algorithms in the application field (i.e. Distribution Substations, RES, etc.). |
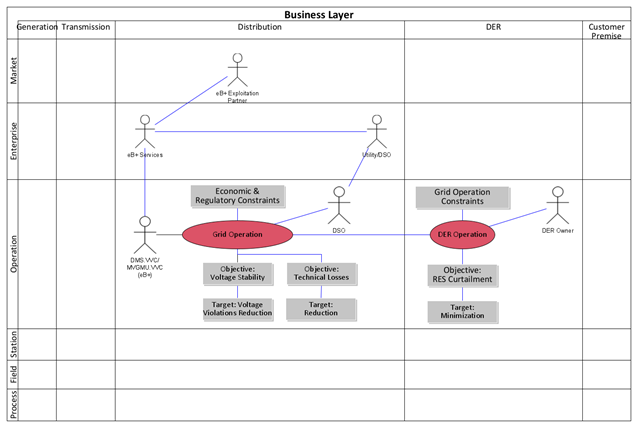
| Objective(s) | a. To demonstrate the impact of Volt/VAr optimization on voltage stability |
| b. To demonstrate the impact of Volt/VAr optimization on technical power losses | |
| c. To demonstrate the impact of Volt/VAr optimization on RES curtailment | |
| d. To demonstrate the performance of Volt/VAr optimization both with a centralized and a distributed implementation with respect to possible failures in both approaches. | |
| Related business case(s) | None |
1.4. Narrative of Use Case
Short description
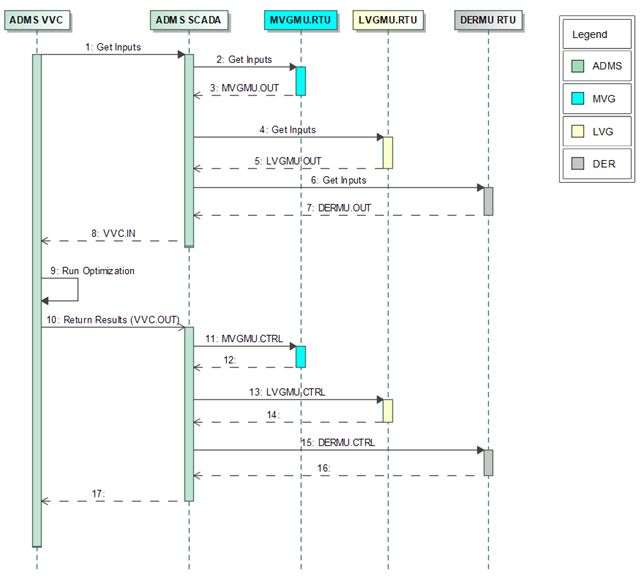
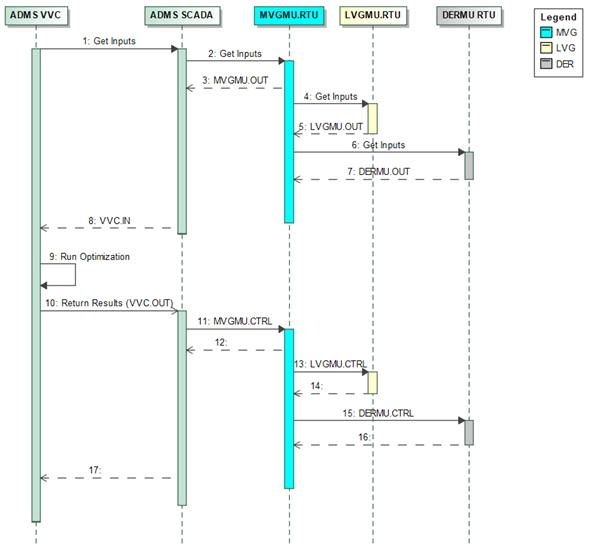
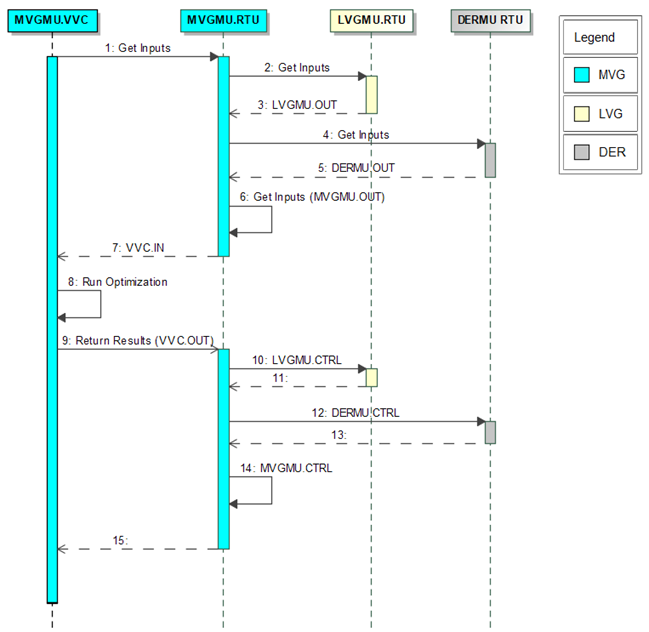
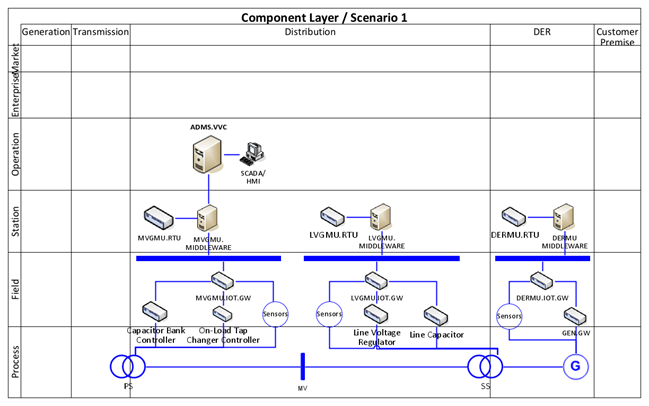
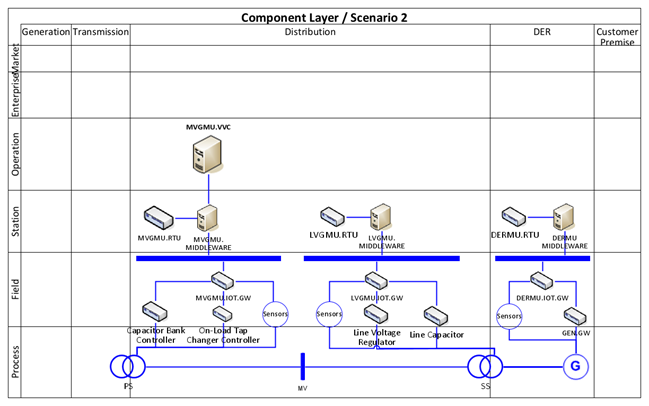
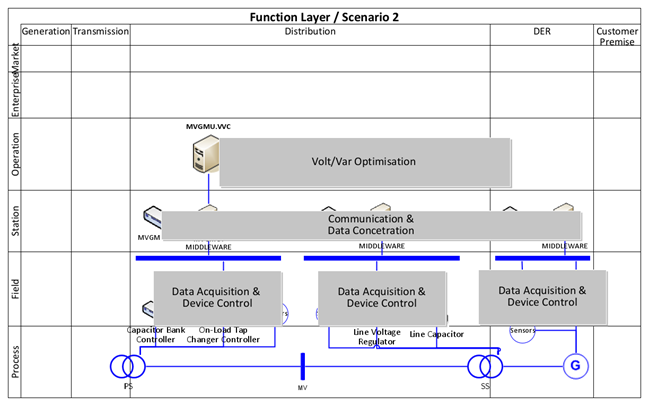
The proposed Use Case refers to Volt-VAr optimization in a Power Distribution Grid incorporating DER (mainly RES), aiming to apply and demonstrate concepts and technologies of the eBalance+ project. The Use Case shall evaluate a specific distribution grid topology (TBD) in three different setups: 1. Laboratory Numerical Simulation, 2. Laboratory Simulation with Hardware-in-the-Loop (of eBalance+ management units), 3. Actual performance in project’s demo site(s). Regarding setup 3 (demo site) certain modifications in the distribution grid topology are anticipated, mainly due to the limitations of access to grid assets, as well as the limitations to intervene in the present control schemes. Two core scenarios will be presented: 1. Centralized, 2. Distributed. In the Centralized Scenario the Volt-VAr control is arbitrated and executed in the (A)DMS system (assumed to exist). The information is exchanged via the eBalance+ middleware and the MVGMU, LVGMU and DERMU devices (management units) are mainly used for communication interfacing and as remote terminal points (RTUs). In the Distributed scenario, the Volt-Var control is performed in the MVGMU device as an alternate scenario in case of central systems failures. As in the Centralized scenario, the LVGMU and DERMU are used for communication interfacing, again following eBalance+ middleware information routes.
Complete description
The present Use Case aims on the following:
• Increased RES penetration in power distribution grids causes congestion and effective Volt-VAr optimization can intelligently manage RES to alleviate the problem.
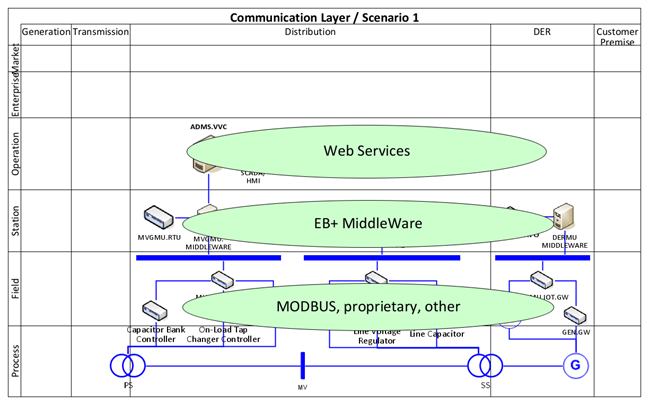
• An information/communication middleware (ebalance+) adopted by intelligent management units installed in the Operation, Station, and Field domains (following SGAM notation) can increase overall system resilience by means of automatic re-configuration and continuity of Volt-VAr service.
• Intelligent management units in the Station and Field domains (e.g. MVGMU) are able to provide optimized Volt-VAr service.
• Distributed intelligence could support Volt-VAr optimization approaches
• Simulate respective Volt-Var optimization approaches
• Apply Hardware-in-the-loop of the eBalance+ intelligent devices in the above simulations
• Apply selected Volt-VAr optimization scenarios in the eBalance+ pilot installations
• Measure and analyze performance in the demo sites
The Volt-VAr Use Case is based on the following methodology:
- Define a configurable power distribution grid topology
a. Based on detailed analysis the topology may incorporate assets, such as: HV/MV Substation, Substation Capacitor Bank, Substation Transformer with On-Load TAP changer, MV RES, MV/LV Transformer with Voltage Regulator, MV Line Capacitors, LV RES, MV Loads, LV Loads, etc.
b. The topology shall define the connections between the assets and perhaps possible reconfigurations (e.g. power switches, etc.)
c. The RES generation shall be configurable (e.g. define three RES penetration scenarios: 50%, 100%, 200%).
d. Part of the overall topology will be similar to the demo installation topologies
- Define various congestion situations
- Define specific optimization objective functions: Voltage Range, Power Loss Reduction, Minimum RES Curtailment
- Define specific KPIs to support evaluation, comparisons and reporting: Voltage Violations (Frequency, Duration, Number, Excess), Power Losses, RES Energy, (optional KPIs depending on available control of assets: number of capacitor transitions, number of OLTC transitions, etc.)
- Implement two scenarios:
a. Centralized Volt-VAr: the solver is executed in the (A)DMS at the DSO’s Operation Center
b. Distributed Volt-VAr: the solver is executed in the intelligent device in the Primary Distribution Substation (e.g. MVGMU)
- Evaluate and compare the two scenarios
- Evaluate and compare the grid’s performance before and after the application of optimization
- The Use Case shall be implemented according to the following phases:
a. Phase 1: Analysis, definitions and laboratory numerical simulations
b. Phase 2: Laboratory simulations with Hardware-in-the-loop (e.g. MVGMU, LVGMU, DERMU in the simulation loop)
c. Phase 3: Demo sites operations
| ID | Name | Description | Reference to mentioned use case objectives |
|---|
| KPI.01 | Reduction of voltage violations | Based on the application of the Voltage Range objective function, this KPI measures the Frequency, Count and Duration of Voltage Violations per bus | Voltage Range, |
1.6. Use case conditions
| Relation to other use cases |
|---|
|
| Level of depth |
| Prioritisation |
| Mandatory |
| Generic, regional or national relation |
| Generic |
| Nature of the use cases |
| Technical |
| Further keywords for classification |
| Advanced Distribution Management System, optimisation, simulation, RES, substation |
2. Diagrams of Use Case


3. Technical Details
3.1. Actors
| Actor Name | Actor Type | Actor Description | Further information specific to this Use Case |
|---|
| DSO / Utility | Role | Responsible for operating, ensuring the maintenance of and, if necessary, developing the distribution system in a given area | |
| Service Provider | Role | Industrial partner involved in the ebalance+ project providing providing management units and algorithms | |
| DER Owner | Role | The owner of DER installation (see below) or the appointed representative that allows flexibility management | |
| DER installation(s) | System(s) | Small generation plant(s) (mainly of renewable energy) owned by a legal person | |
| MVGMU, LVGMU, DERMU | System(s) | All devices placed on MV/LV network for monitoring or gathering information on grid’s situation or electrical parameters values. It also includes the IS associated | |
| SCADA, (A)DMS | Systems | All the hardware and software associated, used at power command to control and monitor the network | |
| DMS.VVC | System | The software that performs the algorithms and produces the desired results. Operates at the DMS level | |
| MVGMU.VVC | System | The software that performs the algorithms and produces the desired results. Operates at the MVGMU level | |
3.2. References
| No. | References Type | Reference | Status | Impact on Use Case | Organistaor / Organisation | Link |
|---|
4. Step by Step Analysis of Use Case
4.1. Overview of Scenarios
| No. | Scenario Name | Scenario Description | Primary Actor | Triggering Event | Pre-Condition | Post-Condition |
|---|
| PS1 | Centralized Volt/Var Optimization with RES Variability | The optimization logic is performed on the Distribution Management System level by collecting readings from the complete underlying grid. In turn control actions computed by the algorithm are distributed to the complete grid. The Primary scenario is separated in the following cases: 1. Nominal scenario, where the grid experiences no failures 2. DMS failure 3. MVGMU failure 4. LVGMU failure 5. DERMU failure | | Centralized Volt/Var Optimization with RES Variability | | |
| AS1 | Distributed Volt/Var Optimization with RES Variability | The optimization logic is performed on the Medium Voltage Grid level by collecting readings from the complete underlying grid. In turn control actions computed by the algorithm are distributed to the complete grid | | Distributed Volt/Var Optimization with RES Variability | | |
Notes
4.2. Steps – Scenarios
| Scenario Name: |
|---|
| Centralized Volt/Var Optimization with RES Variability |
| Step No. | Event. | Name of Process/ Activity | Description of Process/ Activity. | Service | Information Producer (Actor) | Information Receiver (Actor) | Information Exchanged | Requirements, R-ID |
|---|
| 1.1 | Periodic Execution /No Failures – Set Inputs | None | DMS sets all the required input to VVC | GET | | | | |
| 1.2 | Periodic Execution – Optimization | None | VVC performs optimization algorithm on given inputs (Optimum Power flow) | EXECUTE | | | | |
| 1.3 | Periodic Execution – Get Outputs | None | VVC sends control signals based on results | CHANGE | | | | [VVC.008] The VVC function shall calculate the following: |
- Capacitor Bank New Status (on/off per capacitor)
- TAP Position (number)
- Line Capacitor Status (on/off flag)
- RES Set-Point (desired power factor per RES source)
[VVC.009] All outputs shall be provided to the SCADA in the case of DMS deployment
[VVC.010] All outputs shall be provided to the MVGMU.RTU in the case of MVGMU deployment
[VVC.011] Any not-set values shall be denoted by “null” |
| 1.4 | Reporting | None | VVC computes and reports KPI compliance (continued process across multiple runs) | REPORT | | | | [VVC.012] The VVC shall be able to report the value of its KPIs
[VVC.013] The KPIs shall be measured by the VVC function after it provides outputs. |
| 2.1 | DMS Failure Set Inputs | None | DMS.VVC tries to collect inputs but communication has failed. (Please see AS1) | GET | | | | |
| 3.1 | MVGMU Failure Set Input | None | DMS.VVC tries to collect all inputs but MVGMU fails to provide | GET | | | | |
| 3.2 | Periodic Execution – Optimization | None | VVC performs optimization algorithm on given inputs (Optimum Power flow) without input from MVGMU | EXECUTE | | | | |
| 3.3 | Periodic Execution – Get Outputs | None | VVC sends control signals based on results | CHANGE | | | | [VVC.008] The VVC function shall calculate the following:
- Capacitor Bank New Status (on/off per capacitor)
- TAP Position (number)
- Line Capacitor Status (on/off flag)
- RES Set-Point (desired power factor per RES source)
[VVC.009] All outputs shall be provided to the SCADA in the case of DMS deployment
[VVC.010] All outputs shall be provided to the MVGMU.RTU in the case of MVGMU deployment
[VVC.011] Any not-set values shall be denoted by “null” |
| 3.4 | Reporting | None | VVC computes and reports KPI compliance (continued process across multiple runs) | REPORT | | | | [VVC.012] The VVC shall be able to report the value of its KPIs
[VVC.013] The KPIs shall be measured by the VVC function after it provides outputs. |
| 4.1 | LVGMU Failure Set Input | None | DMS.VVC tries to collect all inputs but LVGMU fails to provide | GET | | | | |
| 4.2 | Periodic Execution – Optimization | None | VVC performs optimization algorithm on given inputs (Optimum Power flow) without input from LVGMU | EXECUTE | | | | |
| 4.3 | Periodic Execution – Get Outputs | None | VVC sends control signals based on results | CHANGE | | | | [VVC.008] The VVC function shall calculate the following:
- Capacitor Bank New Status (on/off per capacitor)
- TAP Position (number)
- Line Capacitor Status (on/off flag)
- RES Set-Point (desired power factor per RES source)
[VVC.009] All outputs shall be provided to the SCADA in the case of DMS deployment
[VVC.010] All outputs shall be provided to the MVGMU.RTU in the case of MVGMU deployment
[VVC.011] Any not-set values shall be denoted by “null” |
| 4.4 | Reporting | None | VVC computes and reports KPI compliance (continued process across multiple runs) | REPORT | | | | [VVC.012] The VVC shall be able to report the value of its KPIs
[VVC.013] The KPIs shall be measured by the VVC function after it provides outputs. |
| 5.1 | DERMU Failure Set Input | None | DMS.VVC tries to collect all inputs but DERMU fails to provide | GET | | | | |
| 5.2 | Periodic Execution – Optimization | None | VVC performs optimization algorithm on given inputs (Optimum Power flow) without input from DERMU | CHANGE | | | | |
| 5.3 | Periodic Execution – Get Outputs | None | VVC sends control signals based on results | CHANGE | | | | [VVC.008] The VVC function shall calculate the following:
- Capacitor Bank New Status (on/off per capacitor)
- TAP Position (number)
- Line Capacitor Status (on/off flag)
- RES Set-Point (desired power factor per RES source)
[VVC.009] All outputs shall be provided to the SCADA in the case of DMS deployment
[VVC.010] All outputs shall be provided to the MVGMU.RTU in the case of MVGMU deployment
[VVC.011] Any not-set values shall be denoted by “null” |
| 5.4 | Reporting | None | VVC computes and reports KPI compliance (continued process across multiple runs) | REPORT | | | | [VVC.012] The VVC shall be able to report the value of its KPIs
[VVC.013] The KPIs shall be measured by the VVC function after it provides outputs. |
| Scenario Name: |
|---|
| Distributed Volt/Var Optimization with RES Variability |
| Step No. | Event. | Name of Process/ Activity | Description of Process/ Activity. | Service | Information Producer (Actor) | Information Receiver (Actor) | Information Exchanged | Requirements, R-ID |
|---|
| 0 | Configuration | None | MVGMU Configures VVC according to VVC.CONF | CREATE | | | | [VVC.001] The execution period shall be expressed in seconds |
[VVC.002] The topology provided to the VVC function shall include the following:
- Line Specification (length, conductance)
- Load Specification
- Generator Specification (rated power)
- RES Generator Specification (rater power, inverter specification)
- Transformer Specification (voltage step, losses)
- Capacitor specification (capacitance)
- TAP Specification (voltage Step) |
| 1.1 | Periodic Execution /No Failures – Set Inputs | None | MVGMU sets all the required input to VVC | GET | | | | |
| 1.2 | Periodic Execution – Optimization | None | VVC performs optimization algorithm on given inputs (Optimum Power flow) | EXECUTE | | | | |
| 1.3 | Periodic Execution – Get Outputs | None | VVC sends control signals based on results | CHANGE | | | | [VVC.008] The VVC function shall calculate the following:
- Capacitor Bank New Status (on/off per capacitor)
- TAP Position (number)
- Line Capacitor Status (on/off flag)
- RES Set-Point (desired power factor per RES source)
[VVC.009] All outputs shall be provided to the SCADA in the case of DMS deployment
[VVC.010] All outputs shall be provided to the MVGMU.RTU in the case of MVGMU deployment
[VVC.011] Any not-set values shall be denoted by “null” |
| 1.4 | Reporting | None | VVC computes and reports KPI compliance (continued process across multiple runs) | REPORT | | | | [VVC.012] The VVC shall be able to report the value of its KPIs
[VVC.013] The KPIs shall be measured by the VVC function after it provides outputs. |
| 2.1 | DMS Failure Set Inputs | None | MVGMU.VVC tries to collect inputs but DMS has failed | GET | | | | |
| 2.2 | Periodic Execution – Optimization | None | VVC performs optimization algorithm on given inputs (Optimum Power flow) without input from MVGMU | EXECUTE | | | | |
| 2.3 | Periodic Execution – Get Outputs | None | VVC sends control signals based on results | CHANGE | | | | [VVC.008] The VVC function shall calculate the following:
- Capacitor Bank New Status (on/off per capacitor)
- TAP Position (number)
- Line Capacitor Status (on/off flag)
- RES Set-Point (desired power factor per RES source)
[VVC.009] All outputs shall be provided to the SCADA in the case of DMS deployment
[VVC.010] All outputs shall be provided to the MVGMU.RTU in the case of MVGMU deployment
[VVC.011] Any not-set values shall be denoted by “null” |
| 2.4 | Reporting | None | VVC computes and reports KPI compliance (continued process across multiple runs) | REPORT | | | | [VVC.012] The VVC shall be able to report the value of its KPIs
[VVC.013] The KPIs shall be measured by the VVC function after it provides outputs. |
| 3.1 | MVGMU Failure Set Input | None | MVGMU.VVC tries to collect all inputs but MVGMU fails to provide | GET | | | | |
| 4.1 | LVGMU Failure Set Input | None | MVGMU.VVC tries to collect all inputs but LVGMU fails to provide | GET | | | | |
| 4.2 | Periodic Execution – Optimization | None | VVC performs optimization algorithm on given inputs (Optimum Power flow) without input from LVGMU | EXECUTE | | | | |
| 4.3 | Periodic Execution – Get Outputs | None | VVC sends control signals based on results | CHANGE | | | | [VVC.008] The VVC function shall calculate the following:
- Capacitor Bank New Status (on/off per capacitor)
- TAP Position (number)
- Line Capacitor Status (on/off flag)
- RES Set-Point (desired power factor per RES source)
[VVC.009] All outputs shall be provided to the SCADA in the case of DMS deployment
[VVC.010] All outputs shall be provided to the MVGMU.RTU in the case of MVGMU deployment
[VVC.011] Any not-set values shall be denoted by “null” |
| 4.4 | Reporting | None | VVC computes and reports KPI compliance (continued process across multiple runs) | REPORT | | | | [VVC.012] The VVC shall be able to report the value of its KPIs
[VVC.013] The KPIs shall be measured by the VVC function after it provides outputs. |
| 5.1 | DERMU Failure Set Input | None | MVGMU.VVC tries to collect all inputs but DERMU fails to provide | GET | | | | |
| 5.2 | Periodic Execution – Optimization | None | VVC performs optimization algorithm on given inputs (Optimum Power flow) without input from DERMU | CHANGE | | | | |
| 5.3 | Periodic Execution – Get Outputs | None | VVC sends control signals based on results | CHANGE | | | | [VVC.008] The VVC function shall calculate the following:
- Capacitor Bank New Status (on/off per capacitor)
- TAP Position (number)
- Line Capacitor Status (on/off flag)
- RES Set-Point (desired power factor per RES source)
[VVC.009] All outputs shall be provided to the SCADA in the case of DMS deployment
[VVC.010] All outputs shall be provided to the MVGMU.RTU in the case of MVGMU deployment
[VVC.011] Any not-set values shall be denoted by “null” |
| 5.4 | Reporting | None | VVC computes and reports KPI compliance (continued process across multiple runs) | REPORT | | | | [VVC.012] The VVC shall be able to report the value of its KPIs
[VVC.013] The KPIs shall be measured by the VVC function after it provides outputs. |
| Information exchanged ID | Name of Information | Description of Information Exchanged | Requirement |
|---|
6. Requirements (optional)
| Category Identifier | Name | Description | mRID |
|---|
| Req_ID | Req_Name | ‘Volt-VAr optimization with increasing RES generation’ | |
| Identifier | Name | Description | mRID |
|---|
| VVC.CONF | VVC Configuration | Describes all the configuration options needed to be set to the VVC from the SCADA or RTU system that contains the VVC. These options only need to be set once and are: | |
- Grid Topology
- Execution Period | [VVC.001] The execution period shall be expressed in seconds
[VVC.002] The topology provided to the VVC function shall include the following:
- Line Specification (length, conductance)
- Load Specification
- Generator Specification (rated power)
- RES Generator Specification (rater power, inverter specification)
- Transformer Specification (voltage step, losses)
- Capacitor specification (capacitance)
- TAP Specification (voltage Step) |
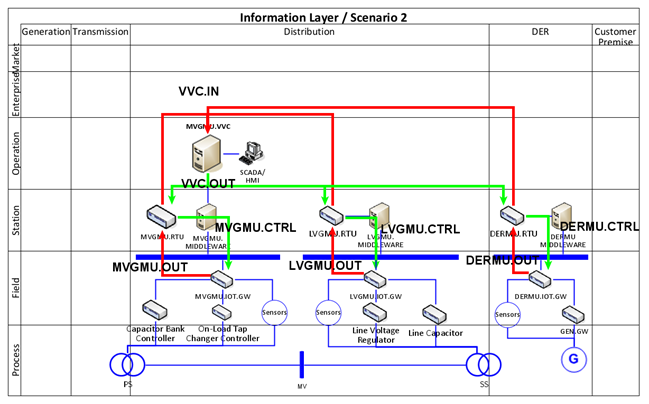
| VVC.IN | VVC Input Execution Parameters | Describes the Information needed for a Volt/Var execution loop to compute. These are provided by the SCADA or RTU system that contains the VVC and are the following:
- Voltage (Distribution Grid)
- Active Power (Distribution Grid)
- Reactive Power (Distribution Grid)
- TAP Position
- Capacitor Bank Status
- Voltage (RES)
- Active Power (RES)
- Reactive Power (RES) | [VVC.003] The VVC function shall get as input the Distribution Grid state, which is:
- Voltage (V)
- Active Power (MW)
- Reactive Power (MW)
- TAP Position (number)
- Capacitor Bank Status (on/off per capacitor)
[VVC.004] The VVC function shall get as input the RES state, which is:
- Voltage (V)
- Active Power (MW)
- Reactive Power (MVar)
[VVC.005] All the inputs shall be provided by the SCADA in the case of DMS deployment (scenario 1)
[VVC.006] All the inputs shall be provided by the MVGMU RTU in the case of MVGMU deployment (scenario 2)
[VVC.007] All the inputs shall be provided
Inputs that have no value for any reason shall be denoted as “null” |
| VVC.OUT | VVC Output Results | Describes the results returned from the VVC after an execution loop. All results are returned to the SCADA or RTU system that contains the VVC which is then responsible to route them to the correct components. The output variables are:
- Capacitor Bank New Status
- TAP Position
- Line Capacitor Status
- RES set-points | [VVC.008] The VVC function shall calculate the following:
- Capacitor Bank New Status (on/off per capacitor)
- TAP Position (number)
- Line Capacitor Status (on/off flag)
- RES Set-Point (desired power factor per RES source)
[VVC.009] All outputs shall be provided to the SCADA in the case of DMS deployment
[VVC.010] All outputs shall be provided to the MVGMU.RTU in the case of MVGMU deployment
[VVC.011] Any not-set values shall be denoted by “null” |
| VVC.RPT | VVC Reporting | Describes the metrics computed after operation for the evaluation target KPIs. These metrics are aggregated in a temporal and a statistical manner and are persistent across runs. The Metrics are:
- Voltage Violations Frequency
- Voltage Violations Count
- Voltage Violation Duration
- Voltage Violation Excess
- Power Losses
- RES Energy
- RES Curtailment percentage
- Number of Capacitor Switches
- Number of OLTC Switches | [VVC.012] The VVC shall be able to report the value of its KPIs
[VVC.013] The KPIs shall be measured by the VVC function after it provides outputs. |
| MGVMU.OUT | MGVMU RTU Outputs/Measurements | Describes all the values measured and retrieved from the specific RTU. These are:
- Capacitor Bank Measurement
- Tap Measurement
- Voltage
- Reactive Power
- Active Power | [VVC.014] The MVGMU.RTU shall provide its measurements to the SCADA (scenario 1)
[VVC.015] The MVGMU shall provide its measurements to the VVC function directly (scenario 2)
[VVC.016] The measurements of the MVGMU.RTU shall be:
- Capacitor Bank Status (on/off per capacitor)
- Tap Measurement (number)
- Voltage (V)
- Reactive Power (MVAr)
- Active Power (MW) |
| MGVMU.CTRL | MGVMU RTU Control Input | Describes all the elements that the specific RTU can control. These are:
- TAP Position
- Capacitor State | [VVC.017] The MVGMU shall receive control signals from the SCADA as calculated by the VVC function (scenario 1)
[VVC.018] The MVGMU shall receive control signals from the VVC function directly (scenario 2)
[VVC.019] The MVGMU.RTU shall support the following control signals:
- TAP Position (number)
- Capacitor State (on/off per capacitor) |
| LVGMU.OUT | LVGMU Output measurements | Describes all the values measured and retrieved from the specific RTU. These are:
- Line Capacitor Status
- Line Voltage Measurement
- Reactive Power
- Active Power | [VVC.020] The LVGMU.RTU shall provide its measurements to the SCADA (scenario 1)
[VVC.021] The LVGMU shall provide its measurements to the MVGMU (scenario 2)
[VVC.022] The measurements of the LVGMU.RTU shall be:
- Line Capacitor Status (on/off flag)
- Line Voltage (V)
- Reactive Power (MVAr)
- Active Power (MW) |
| LVGMU.CTRL | LVGMU RTU Control Input | Describes all the elements that the specific RTU can control. These are:
- Line Capacitor State
- Voltage Regulator set-point | [VVC.023] The LVGMU shall receive control signals from the SCADA as calculated by the VVC function (scenario 1)
[VVC.024] The LVGMU shall receive control signals from the MVGMU (scenario 2)
[VVC.025] The LGMU.RTU shall support the following control signals:
- Capacitor State (on/off flag)
- Live Voltage Regulator Set-Point (Power Factor) |
| DERMU.OUT | DERMU Output measurements | Describes all the values measured and retrieved from this unit. These are:
- Voltage (RES)
- Active Power (RES)
- Reactive Power (RES) | [VVC.026] The DERMU.RTU shall provide its measurements to the SCADA (scenario 1)
[VVC.027] The DERMU shall provide its measurements to the MVGMU (scenario 2)
[VVC.028] The measurements of the DERMU.RTU shall be:
- Line Voltage (V)
- Reactive Power (MVAr)
- Active Power (MW) |
| DERMU.CTRL | DERMU Control Input | Describes the controllable element of this unit which is: RES Set-Points. | [VVC.029] The DERMU shall receive control signals from the SCADA as calculated by the VVC function (scenario 1)
[VVC.030] The DERMU shall receive control signals from the MVGMU (scenario 2)
[VVC.031] The DERMU.RTU shall support the following control signals:
- RES Set-Point (Power Factor per RES) |
7. Common Terms and Definitions
| Key | Value | Refers to Section |
|---|