UC1
Monitoring and Visualization of Metering & Sensor Energy Data in community buildings
1. Description of the Use Case
1.1. Name of the Use Case
| ID | Area /Domain(s)/Zone(s) | Name of the Use Case |
|---|
| 1 | Component layer, communication layer / DER, Customer Premises / Building, Operation, | UC1 |
1.2. Version Management
| Version No. | Date | Name of author(s) | Changes | Approval status |
|---|
| v1.0 | 2021-10-05T00:00:00 | QUE, RINA-C, | N/A | Approved by ACCEPT consortium |
1.3. Scope and Objectives of Use Case
| |
|---|
| Scope | The scope of the current use case is to enable collection of high-quality metering and sensing data from a modular and interoperable IoT gateway platform that will also allow for secure communication across actors and components. Also, to provide data visualization means for more efficient communication of events, behaviors and profiles that will allow for deeper understanding. This use case will examine the high value achieved by providing an integrated solution that can be assembled from market available components, act as a hub for off-the-self sensors, meters and actuators, and be compatible for all building types. Depending on the building, different sensors may be needed that need to be integrated into the system |
| Objective(s) | 1. Enable the assembling of the IoT gateway from market available components. |
| 2. Integrate off-the-shelf sensors, actuators and meters according to detailed specifications. | |
| 3. Enable data collection, ingestion and management through IoT Gateway software components. | |
| 4. Provide the means for efficient and meaningful data visualisation through Apps that will give insight and deeper understanding to the users. | |
| Related business case(s) | ACCEPT_UC2 “Building self-consumption employing Virtual Thermal Energy Storage optimisation “ |
| To achieve and optimize self-consumption accurate monitoring and measurements are necessary. | |
| ACCEPT_UC3 “Consumer demand-side flexibility forecasting” | |
| UC1 acts as a starting point in the pipeline from monitoring and metering of building assets towards modeling of the building/occupant and forecasting of flexibility. | |
| ACCEPT_UC4 “Demand elasticity profiling-forecasting-aggregation” | |
| Monitoring and visualization of devices from UC1 contributes to profiling and aggregation of prosumers | |
| ACCEPT_UC8 “Participation in explicit Demand Response schemes” | |
| Participation in explicit Demand Response schemes requires accurate monitoring and metering | |
| ACCEPT_UC9 “Participation in implicit Demand Response schemes” | |
| Participation in implicit Demand Response schemes requires accurate monitoring and metering | |
| ACCEPT_UC13 “Increase self-consumption at local community level” | |
| To maximize self-consumption at community level accurate monitoring and measurements are required. | |
1.4. Narrative of Use Case
Short description
Precise measurement and quantification of flexibility requires precise collection of data while ensuring a secure and seamless information flow across components and actors. The necessary hardware will consist of market available components and off-the-self sensory and measuring equipment that will operate under a common software stack.
Complete description
The key for the accurate measurement and quantification of the available demand flexibility, the participation in energy markets, and achieving high level of self-consumption requires to have access to high quality real-time energy information for consumption and production, inputs from sensory equipment and finally to be able to implement control strategies. The variety of scenarios and the case specific needs require a modular solution, compatible with most building types. Therefore, the infrastructure that will allow the data collection, ingestion and management, as well as the seamless information flow across components and actors will be assembled from market available hardware and off-the-self sensors, actuators and meters. Energy needs, consumption patterns, building/user profiles will be presented through a data visualization scheme that will increase the engagement of the user.
| ID | Name | Description | Reference to mentioned use case objectives |
|---|
1.6. Use case conditions
| Relation to other use cases |
|---|
|
| Level of depth |
| Prioritisation |
| High |
| Generic, regional or national relation |
| Generic |
| Nature of the use cases |
| Technical use case |
| Further keywords for classification |
| Monitoring, Visualisation, Energy Data, Sensor, Measurements |
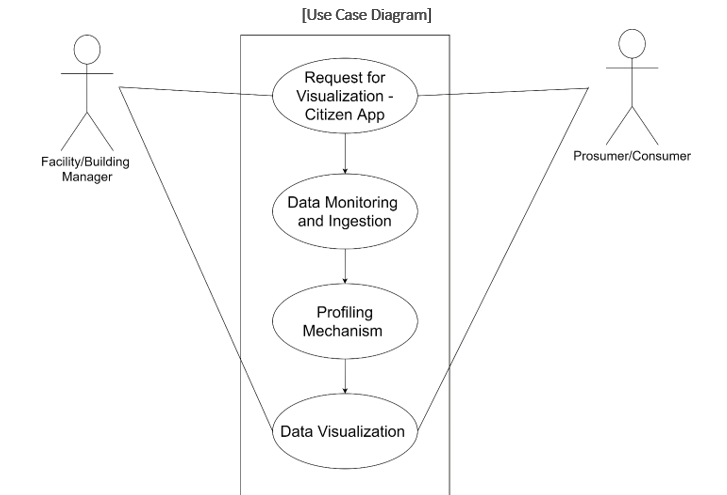
2. Diagrams of Use Case
3. Technical Details
3.1. Actors
| Actor Name | Actor Type | Actor Description | Further information specific to this Use Case |
|---|
| Prosumer/Consumer | Stakeholder | The end user that consumes or produces also in the case of the prosumer | |
| Building Occupant | Stakeholder | The end user that consumes electricity but is not directly charged | |
| Facility/Building Manager | Stakeholder | usually not the end user of electricity but is responsible for billing and maintenance. | |
3.2. References
| No. | References Type | Reference | Status | Impact on Use Case | Organistaor / Organisation | Link |
|---|
4. Step by Step Analysis of Use Case
4.1. Overview of Scenarios
| No. | Scenario Name | Scenario Description | Primary Actor | Triggering Event | Pre-Condition | Post-Condition |
|---|
| S01 | Request for Visualization | Combination of Trigerring Event and Post condition sections | | Request for Visualization | | |
| S02 | Data Monitoring and Ingestion | Combination of Trigerring Event and Post condition sections | | Data Monitoring and Ingestion | | |
| S03 | Profile Mechanism | Combination of Trigerring Event and Post condition sections | | Profile Mechanism | | |
| S04 | Data Visualization | Combination of Trigerring Event and Post condition sections | | Data Visualization | | |
Notes
4.2. Steps – Scenarios
| Scenario Name: |
|---|
| Request for Visualization |
| Step No. | Event. | Name of Process/ Activity | Description of Process/ Activity. | Service | Information Producer (Actor) | Information Receiver (Actor) | Information Exchanged | Requirements, R-ID |
|---|
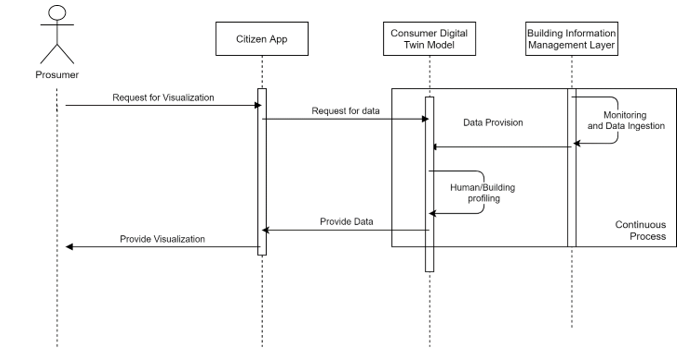
| St01 | Response | Receiving Data from sensors | The BIML receives data form the various sensors | Management | | | | |
| St02 | Response | Data Ingestion | Data that have been received from sensors are identified, cleansed and normalized | Management | | | | |
| Scenario Name: |
|---|
| Data Monitoring and Ingestion |
| Step No. | Event. | Name of Process/ Activity | Description of Process/ Activity. | Service | Information Producer (Actor) | Information Receiver (Actor) | Information Exchanged | Requirements, R-ID |
|---|
| St01 | Response | Continuous data flow from BIML to Digital Twin | Data received and processed from BIML are sent to the Digital Twin | Management | | | | |
| St02 | Response | Human/Building Profiling | Data from sensors and meters are fed into the models to create consumer and building profile | Management | | | | |
| Scenario Name: |
|---|
| Profile Mechanism |
| Step No. | Event. | Name of Process/ Activity | Description of Process/ Activity. | Service | Information Producer (Actor) | Information Receiver (Actor) | Information Exchanged | Requirements, R-ID |
|---|
| St01 | Request | Request for visualization | User through the Citizen App requests data for visualization | Prosumer UI | | | | |
| St02 | Response | Provide Visualization | None | Prosumer UI | | | | |
| Scenario Name: |
|---|
| Data Visualization |
| Step No. | Event. | Name of Process/ Activity | Description of Process/ Activity. | Service | Information Producer (Actor) | Information Receiver (Actor) | Information Exchanged | Requirements, R-ID |
|---|
| Information exchanged ID | Name of Information | Description of Information Exchanged | Requirement |
|---|
6. Requirements (optional)
| Category Identifier | Name | Description | mRID |
|---|
| Req_ID | Req_Name | ‘Monitoring and Visualization of Metering & Sensor Energy Data in community buildings’ | |
| Identifier | Name | Description | mRID |
|---|
| INF 1.1 | Sensing and metering data | Raw data that have been received from meters and sensors (temperature, humidity, luminance etc.) | Sensors and meters have been installed properly |
| INF 1.2 | Processed and cleansed sensing and metering data | Data that have been cleansed | INF 1.2 |
| INF 2.1 | Processed and cleansed data | Cleansed and normalized data | Internet connection established |
| INF 2.2 | User Preferences | Profile of user and building | Models are calibrated and trained |
| INF 3.1 | Request parameters | Parameters for data to be visualized (type of data, time period etc.) | Internet Internet Connection |
| INF 3.2 | Visualized data | Data read to be visualized | INF 3.2 |
7. Common Terms and Definitions
| Key | Value | Refers to Section |
|---|